Reports
Dashboards
Analytics

Real Answers that Create
Real Profit for Your Fuel Business

Software to protect margins, monitor efficiencies, and benchmark performance.
No more manual and costly spreadsheets. No more guesswork.
Decisions at the Speed of Your Business

Stop running your operations on last month's data. MyEnergyBoard turns every gallon, every stop, and every customer transaction into signals your team can act on today, not after the books close.

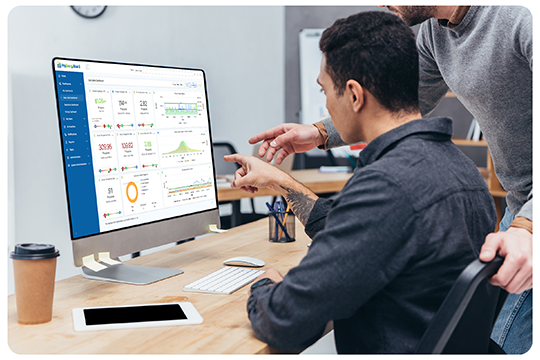
Team reviewing MyEnergyBoard
Visibility
Insights into efficiency and profitability that were previously inaccessible or missed.
Faster
A unified platform that allows you to see trends and protect margins before it's too late.
Comprehensive
Insights into all facets of your business, giving you the ability to make corrections before they erode the bottom line.

How it works

01

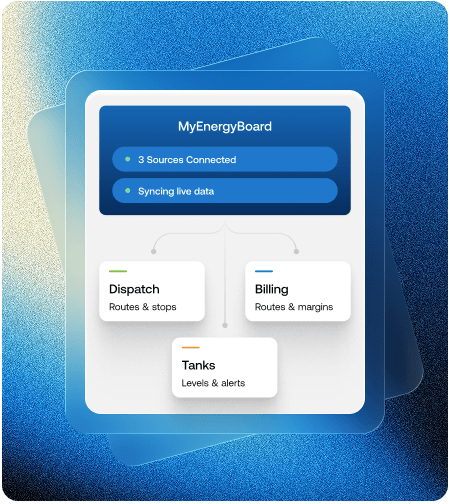
Connect your existing billing, dispatch, and customer systems. MyEnergyBoard pulls everything into one place—no expensive IT project required.

02

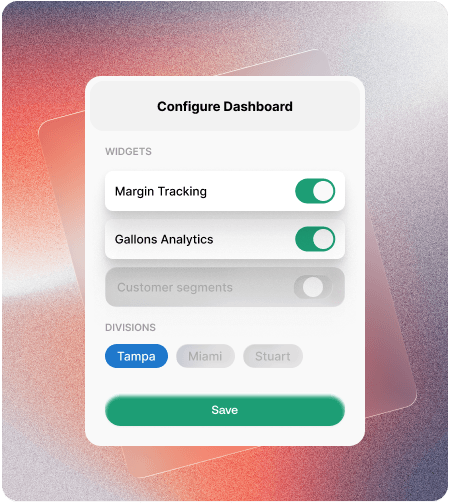
Pick the widgets, divisions, and metrics that matter most to you or your team. Set goals and margin targets once, and the dashboard does the rest.

03

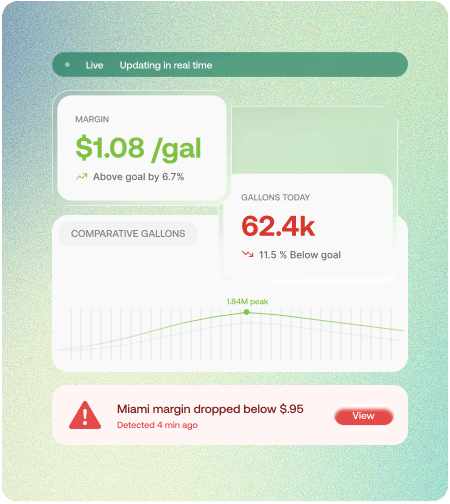
Watch margins, gallons, and customer trends. Spot problems early, catch wins or errors as they happen, and make decisions based on what's happening today—not last month.

Running a Fuel Operation
Shouldn't Feel Like Flying Blind

Most operators are sitting on the data they need. The problem is visualizing it in the right format and providing the right insights to help drive efficiency and profitability.

Lost Margins You Catch After It’s Too Late

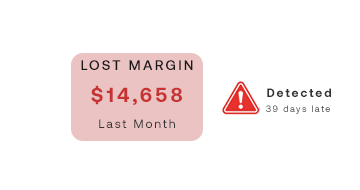
By the time month-end reports land, the margin and lost productivity are already gone. A few cents per gallon adds up fast, with no way to course-correct.

Data Trapped in Complex Systems that Take Hours to Put Together

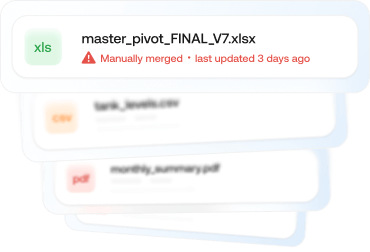
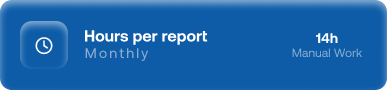
Delivery, billing, inventory, and customer records can feel trapped and hard to access, while pulling reports is cumbersome and can take hours.

Reporting That Tells You What Happened, But Not What to Do

Month-end static reports show you the past. They do not flag which division or customer is slipping or which segment is quietly eroding your margin.

Everything You Need to Run a More Profitable Operation

Features built for how fuel and energy teams actually work.

Real-Time Margin Tracking

Monitor margins down to the cent per gallon. Compare against goals and industry averages at a glance.

AI-Powered Analytics

Use secure, optional, and selective AI analysis to uncover powerful and beneficial insights.

Exception Notifications

Receive notifications when thresholds are met, so you can manage by exception instead of information overload.

Efficiency Metrics

Track deliveries and work orders down to the second. Spot underperforming transactions and trends so your team can take corrective action.

Customizable Dashboard Widgets

Build the view that matches your role. Add, remove, and rearrange widgets, timeframes, goals, and thresholds.

Division-Level Reporting

Roll performance up across divisions or drill into a single location—big picture and details, side by side.

Strategic Planning

Review tank density and efficiency to support expansion and resource decisions.

Comparative Gallons Analytics

Compare this year with previous years on one chart. Spot trends and year-over-year shifts instantly.

Customer Segmentation Insights

Break down performance by customer type, division, and status. Know where sales, retention, and churn come from.

Ready to Increase Your
Visibility, Efficiencies, and Profits?

Join the fuel operators building sharper, faster, and more profitable operations with MyEnergyBoard.

Dashboards • Reporting • Notifications • And so much more!